 ⬇️
⬇️
Key Takeaways
- Unified analytics dashboards combine communications, customer, and workforce data so managers can identify service problems and respond faster.
- Real-time alerts, speech analysis, sentiment indicators, and coaching applications can turn reporting into operational action.
- Buyers should evaluate data integration, metric consistency, workflow support, governance, and total implementation effort rather than dashboard appearance alone.
Customer interactions now move among voice calls, digital channels, self-service systems, and physical locations. Yet the data describing those interactions often remains divided across telephony, contact center, CRM, and workforce platforms. Managers receive reports after the fact, while agents make decisions with only part of the customer's history.
That fragmentation has direct consequences. A restaurant group may see declining call conversion without connecting it to staffing gaps. A healthcare organization might monitor call volume but miss recurring words that signal patient frustration. An automotive service business may track appointments and call outcomes in separate systems, making it difficult to understand why potential customers disengage.
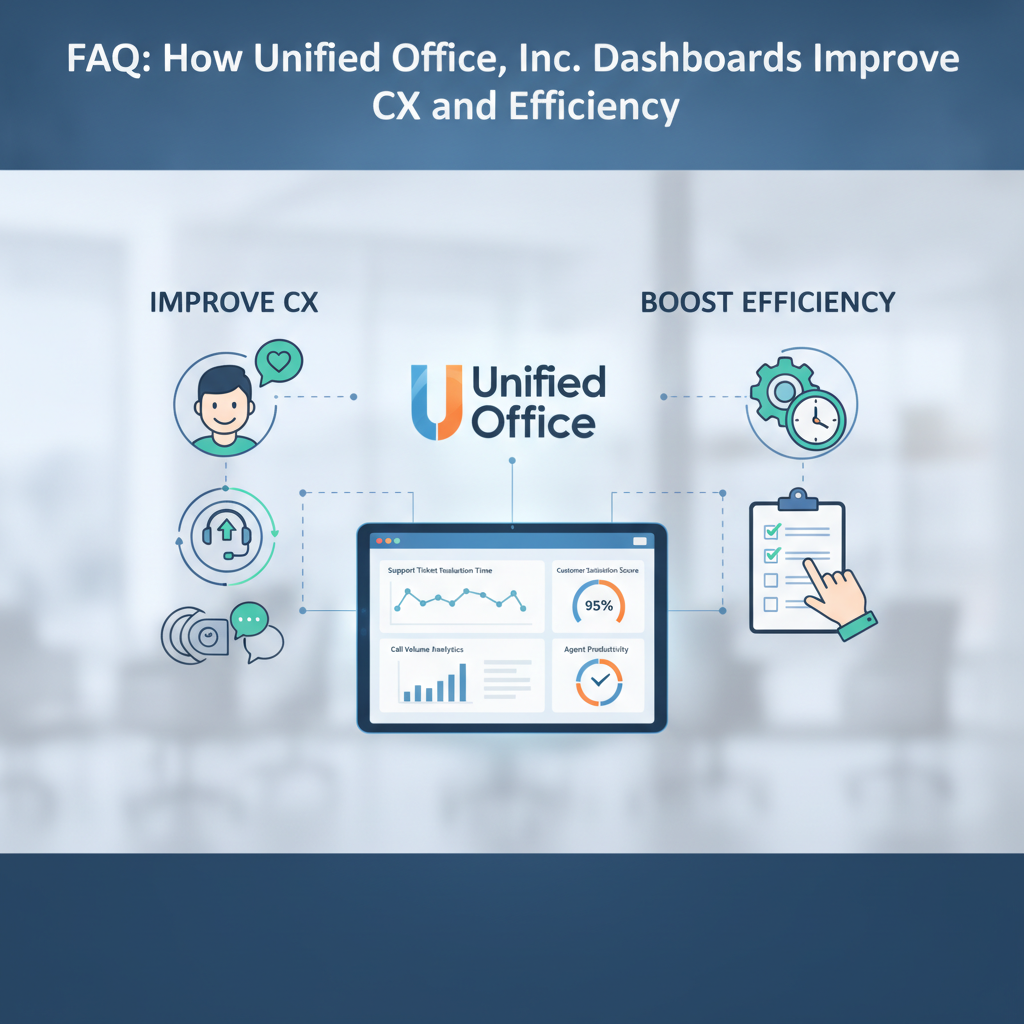
Providers such as Unified Office, Inc. address this fragmentation by combining communications services with real-time business analytics, alerts, AI-powered speech and sentiment analysis, coaching applications, and AI voice agents. The broader goal is to convert communications activity into actionable information that operators can use while an issue still matters.
What is a unified office analytics dashboard?
A unified office analytics dashboard aggregates operational and customer-experience data into a common view. Depending on the deployment, that data can include call volumes, wait times, abandonment rates, agent availability, conversation outcomes, customer sentiment, sales conversions, appointment activity, and staffing levels.
The important word is "unified." A conventional call report might show that 200 customers called a location. A unified dashboard adds context: how many calls were answered, which topics occurred, whether sentiment deteriorated, what happened after each interaction, and whether staffing matched demand.
Unlike generic BI platforms designed to analyze data from diverse enterprise sources through highly configurable pipelines, unified office analytics concentrates specifically on communications-intensive workflows. These solutions provide purpose-built metrics, event alerts, and operational applications without requiring business users to design every analysis from scratch.
Modern customer analytics architectures are also becoming more action-oriented. As CX Today observed in April 2026, the objective is not simply to collect more customer data. Organizations need analytics stacks that help teams act on what the data reveals.
Which capabilities matter most?
Effective dashboards deliver specific capabilities that drive operational improvements. Near-real-time visibility allows supervisors to monitor service demand, answer rates, queues, location performance, and customer outcomes as conditions change. Static monthly reports still have a role, but they are less effective for correcting today's staffing or routing problems.
Instead of expecting managers to watch every metric, automated alerts focus attention by flagging unusual abandonment, negative sentiment, missed calls, service-level deterioration, or demand spikes. Thresholds should be configurable by location, team, or operating period.
Additionally, conversation analytics examine what happened inside an interaction. Spoken-word analysis can identify recurring topics, while sentiment indicators help reveal interactions that warrant review, narrowing the overall quality assurance workload.
Engagement and whisper-coaching applications close an important gap between analysis and execution by presenting guidance during live conversations. Finally, role-based dashboards provide executives, supervisors, and frontline teams with tailored views of the same operation. Executives may need trends across regions, a location manager needs unanswered-call patterns from this morning, and an agent needs immediate, specific guidance.
How do dashboards improve customer experience?
Connected analytics can help organizations reduce friction across the customer journey. Gartner reported in 2023 that organizations using connected customer-service and operational analytics achieved up to a 25% improvement in contact center efficiency and 30% higher customer satisfaction when insights were embedded into agent workflows.
IDC found that enterprises with integrated customer-experience and operational analytics were 2.3x more likely to meet or exceed satisfaction targets. The advantage came from closer alignment among staffing, routing, and journey design.
Dashboards do not improve satisfaction simply by displaying CSAT or Net Promoter Score. Improvement occurs when teams connect those measures to operational causes. A rising Customer Effort Score, for example, could be examined alongside repeat calls, transfers, queue times, and conversation topics.
Consider a multi-location restaurant operator. Analytics might show that missed calls rise during dinner hours at several locations, resulting in lost reservations or orders. Management could adjust staffing, introduce an AI voice agent for common requests, or change routing rules. The dashboard then measures whether those actions reduced missed calls and improved conversion.
Where do operational gains come from?
Advanced analytics can expose process delays that averages tend to hide. McKinsey reported in 2023 that advanced service-operations analytics could reduce handling times by 20% to 30% and increase self-service containment by 10% to 20%.
Workforce optimization adds another layer. A 2024 MyShyft and industry synthesis associated unified dashboards with labor cost reductions of 3% to 5% and productivity gains of 5% to 10% through improved scheduling and demand matching. Results will vary by operating model, data quality, adoption, and baseline performance.
Shorter calls are not automatically better, of course. An aggressive focus on average handle time can encourage rushed interactions and repeat contacts. Balanced dashboards should pair efficiency metrics with first-contact resolution, satisfaction, effort, sentiment, and business outcomes.
What should buyers examine before selecting a platform?
Begin with decisions, not visualizations. Identify which operational questions the platform should answer and who will act on the results. Evaluation criteria should include:
- Integration with telephony, CRM, contact center, workforce, and line-of-business systems
- Data freshness and alert latency
- Support for speech, keyword, sentiment, and interaction analysis
- Role-based access, retention controls, and auditability
- Customizable metrics for locations, teams, and vertical workflows
- Agent coaching and workflow integration
- Implementation effort and ongoing administrative requirements
- API access and export options for broader BI initiatives
Metric governance also matters. Organizations can use CSAT, NPS, and CES consistently across teams while applying ITIL practices to incident and problem management. The ISO 20000 family offers an additional benchmark for service-management quality.
What comes next?
Unified dashboards are moving from descriptive reporting toward prediction and guided action. AI voice agents, automated interaction summaries, anomaly detection, and real-time coaching will make analytics more immediate.
Still, disciplined deployment will matter more than novelty. Buyers that connect trusted data, clear ownership, and measurable workflows are more likely to turn communications analytics into better customer experiences and leaner operations.